Real Time Crypto Performance Analysis
Real time crypto performance analysis helps traders track P&L, allocation, and risk across exchanges with faster, cleaner decision support.
7 min readby The Crypto Hub
A 6% move in BTC can look manageable until you realize your actual portfolio is down more because the losses came from the positions you sized too large, on the exchange you forgot to check, with fees you did not factor in. That is the gap real time crypto performance analysis is meant to close. It is not just about watching prices update every second. It is about seeing what those price moves mean for your holdings, exposure, and next decision.
For active traders and serious investors, that difference matters. A token chart can tell you what the market did. A performance system should tell you what happened to your portfolio, where it happened, and whether your current setup still matches your plan.
What real time crypto performance analysis actually means
At a basic level, real time crypto performance analysis combines live market data with your current holdings, transaction history, and account-level activity. The goal is to show performance as it changes, not hours later after you export files or update a spreadsheet.
That sounds simple, but useful analysis goes beyond a running portfolio balance. It should account for cost basis, realized and unrealized profit and loss, asset allocation, exchange-level exposure, and changes over specific time ranges. If you trade across multiple venues, it should consolidate that activity into one view so your numbers reflect reality instead of fragments.
This is where many setups break down. Traders often have one exchange for spot, another for derivatives, a wallet for long-term holdings, and a separate spreadsheet for taxes. Each tool may be fine on its own, but performance analysis becomes unreliable when the data is split across disconnected systems.
Why price tracking is not enough
Watching market prices in real time is useful, but it is not the same as measuring performance. A coin can be up 12% on the day while your position is still negative because you entered near a local top. Your portfolio can also appear stable while concentration risk is quietly increasing because one asset now represents too much of your total holdings.
Real time crypto performance analysis matters because it answers practical questions quickly. Are you actually profitable this week after fees? Which assets are driving gains versus just taking up capital? Did your hedge reduce volatility, or did it simply add complexity? If the market drops sharply, how much of your portfolio is exposed right now?
Without those answers, decision-making gets slower and more emotional. You end up reacting to headlines or price candles instead of your actual position data.
The core metrics that matter most
Not every trader needs the same dashboard, but most serious users should care about a few core metrics. Live portfolio value is the starting point, not the finish line. You also need unrealized P&L to understand current exposure and realized P&L to separate booked gains from open risk.
Allocation tracking is equally important. If your portfolio target was 40% BTC, 30% ETH, and 30% alt exposure, real-time shifts can move you far off target without any new trades. That drift can increase risk in fast markets.
Cost basis is another non-negotiable metric, especially if you scale in and out of positions. Without accurate cost basis tracking, performance numbers become misleading, and tax reporting becomes harder later. Time-based views also matter. Daily performance is useful for active management, but 30-day and year-to-date views provide context that can prevent overreacting to short-term noise.
If you use leverage or derivatives, exchange-level visibility becomes more important. The same portfolio can look healthy in aggregate while one account carries outsized liquidation risk. Real time analysis should make those pockets visible immediately.
Real time crypto performance analysis across multiple exchanges
Multi-exchange activity is where performance tracking usually gets messy. One account may hold your long-term assets. Another may be where you actively trade. A third may contain leftover balances, staking rewards, or stablecoins used as collateral. Looking at each exchange separately creates blind spots.
Real time crypto performance analysis works best when data from those accounts is aggregated into a single operating view. That lets you measure total exposure, compare exchange balances, monitor allocation drift, and spot where capital is sitting idle.
It also improves execution discipline. If one exchange account is overloaded with volatile small-cap positions while another is mostly cash, your portfolio is not as balanced as it may appear when you check only one venue at a time. Centralized visibility reduces that kind of false confidence.
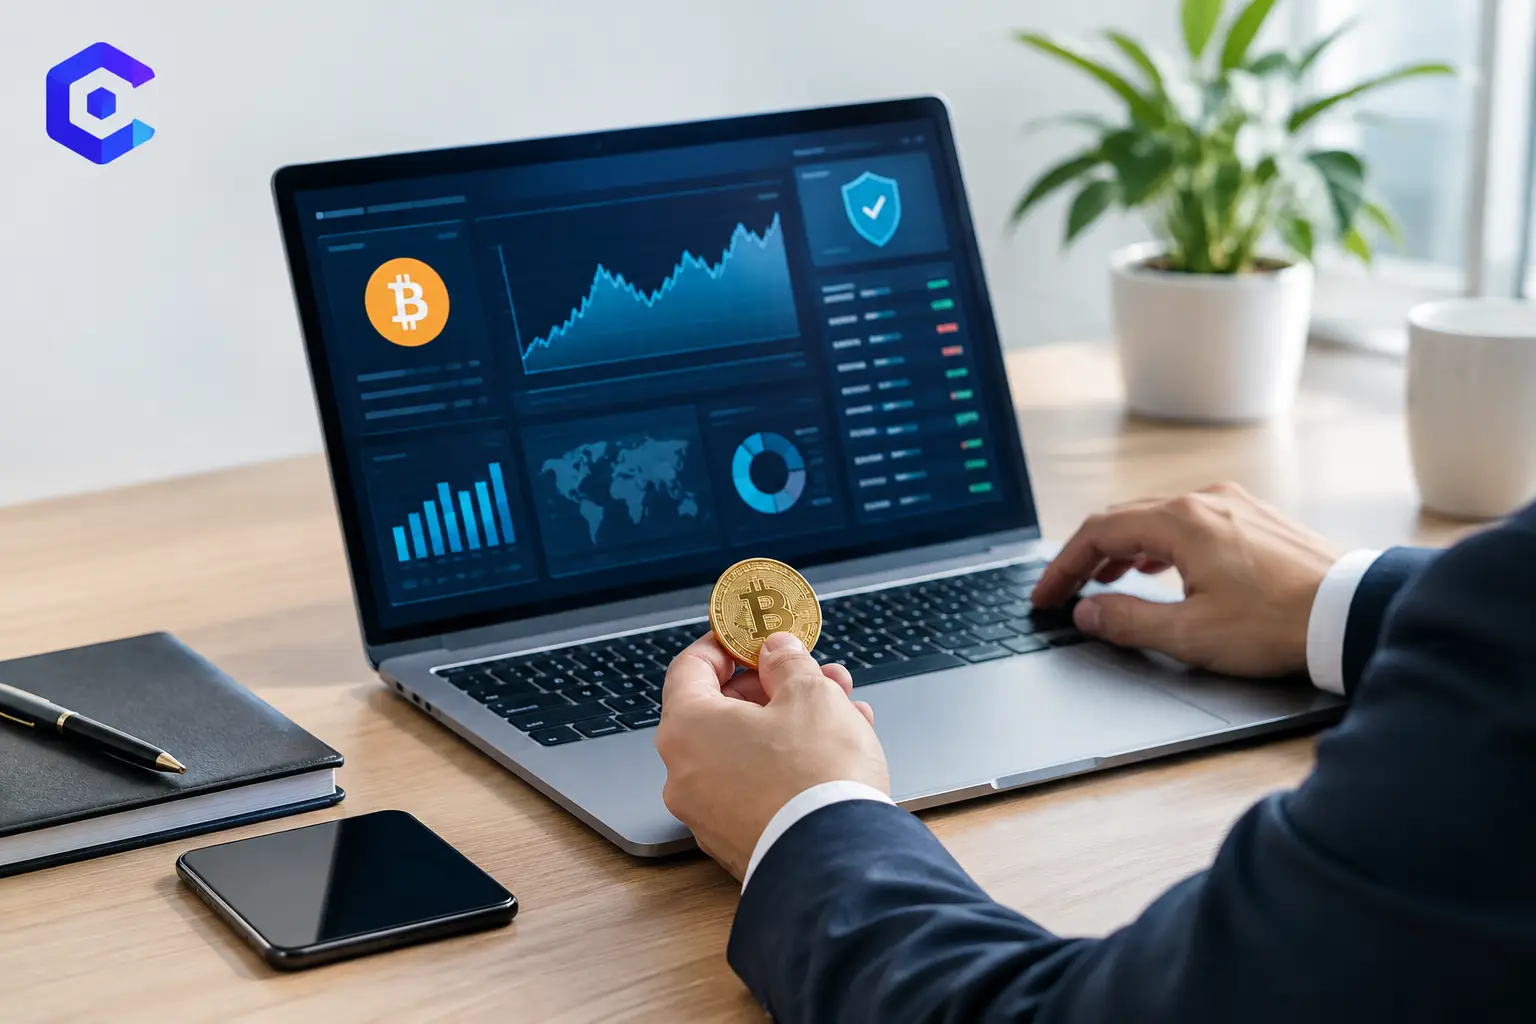
For many users, this is the operational value of a command-center approach. Instead of juggling tabs, exports, and manual reconciliations, you work from one live system that reflects your current positions without requiring trade execution authority.
Where spreadsheets fail
Spreadsheets are flexible, and many traders start there for good reason. They can work if you have a small number of holdings and low transaction volume. But once activity increases, manual tracking becomes slower, easier to break, and harder to trust.
The biggest problem is not inconvenience. It is lag. If your analysis depends on imports or manual updates, then your view is already out of date when the market moves. That delay affects more than reporting. It affects risk management, rebalancing, and tax preparation.
Spreadsheets also struggle with transaction complexity. Transfers between exchanges, partial fills, fee treatment, airdrops, rewards, and derivatives activity can all distort performance if tracked inconsistently. A system built for crypto activity handles these events with more structure and less guesswork.
What to look for in a performance analysis platform
A useful platform should first consolidate data cleanly. Read-only API connections matter because they let you pull exchange data without handing over custody or execution permissions. That keeps the setup aligned with users who want visibility and control without increasing account risk.
Second, the reporting needs to be actionable. A dashboard should show current balances, live P&L, allocation, and historical performance in a way that is easy to interpret quickly. Charting tools help, but only if they answer operational questions instead of adding visual noise.
Third, tax awareness should not sit in a separate silo. Performance analysis and tax reporting are closely connected because cost basis, gains, losses, and transaction categorization affect both. If your tracking tool cannot support compliant reporting later, you may save time now only to create cleanup work at year-end.
This is why platforms like The Crypto Hub are structured around more than just price monitoring. When portfolio visibility, historical analysis, and tax workflows sit in one read-only environment, users spend less time reconciling systems and more time working from accurate data.
The trade-offs to understand
Real-time data is valuable, but more data is not always better. If your dashboard updates constantly but does not prioritize what matters, you can end up watching noise. Long-term holders may not need second-by-second detail across every asset. Active traders usually do.
There is also a trade-off between breadth and precision. Aggregating many exchanges is powerful, but only if the integrations are reliable and transaction handling is consistent. A broad dashboard with poor reconciliation creates false confidence, which is worse than having fewer metrics.
Another factor is user behavior. Real time crypto performance analysis can support disciplined decisions, but it can also encourage over-monitoring. If you check every small fluctuation and respond impulsively, the tool is not the problem, but the workflow needs adjustment. The best setup gives you visibility while still supporting rules, thresholds, and structured review habits.
Turning analysis into better decisions
The point of real-time analysis is not to admire cleaner charts. It is to make better decisions faster. That can mean trimming an overweight position before it dominates portfolio risk. It can mean noticing that an exchange account has become too exposed to one sector. It can mean identifying underused capital and putting it to work more intentionally.
It also helps when markets get messy. In volatile conditions, memory is unreliable and fragmented dashboards slow you down. A consolidated view of holdings, P&L, and allocation gives you a more stable reference point when speed matters.
For US-based users, there is another practical upside. Better ongoing performance tracking usually means fewer surprises at tax time. When transactions are categorized consistently and gains are visible throughout the year, year-end reporting becomes a process instead of a scramble.
The traders who manage crypto well over time are usually not the ones with the most tabs open. They are the ones with the clearest view of what they own, how it is performing, and where the risk actually sits. If your current setup cannot give you that without manual cleanup, that is usually the signal to tighten your system before the next market move forces the issue.
Share this article