Real Time PnL for Multi-Exchange Traders
Real time PnL gives crypto traders a current view of gains, losses, exposure, and fees across accounts so they can manage risk with greater daily control.
7 min readby The Crypto Hub
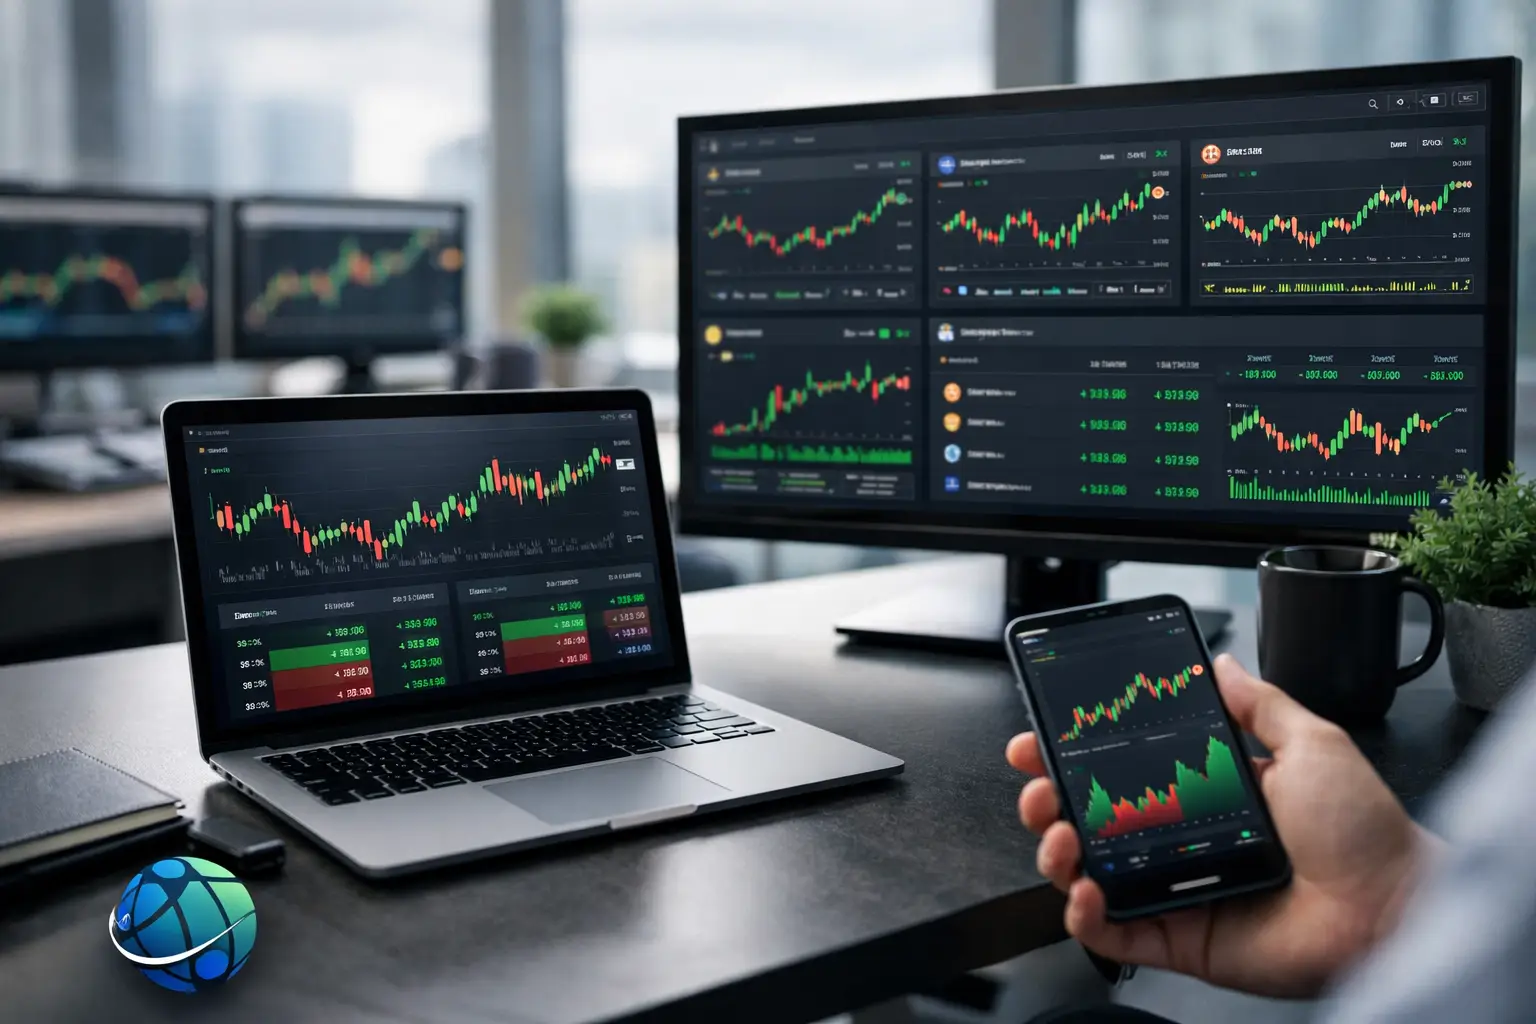
A position can look profitable on one exchange and underperforming on another at the same time. Without a consolidated view, it is easy to react to the loudest chart, miss total exposure, or mistake a temporary price move for a portfolio-level gain. Real time PnL gives active crypto traders a current reading of where they stand across spot, derivatives, and multiple accounts.
That visibility is not about chasing every tick. It is about making decisions with the right numbers in front of you: current market value, unrealized gains or losses, realized results, fees, and the capital committed to each position. For traders operating across exchanges, wallets, and trading strategies, that is the difference between monitoring activity and actually managing it.
What Real Time PnL Shows
PnL means profit and loss. At its simplest, it compares the value of an asset or position with its acquisition or entry cost. A real-time view updates that comparison as market prices move and as new transactions are recorded.
For a spot holding, unrealized PnL is generally the difference between the current market value and the cost basis of assets you still hold. If you bought 1 ETH at $2,500 and it trades at $2,750, the position has a $250 unrealized gain before applicable fees. That gain becomes realized only when you sell, swap, or otherwise dispose of the asset.
For derivatives, the picture can be more complex. A futures or perpetual position may require live mark prices, contract size, entry price, side, leverage, funding payments, and trading fees to present a useful PnL figure. A profitable long can still create account-level risk if margin is tight, while a hedge that loses on its own may be reducing risk elsewhere in the portfolio.
A complete dashboard should therefore separate position-level performance from account-level performance. Both matter, but they answer different questions. Position PnL tells you how a trade is performing. Portfolio PnL shows the effect of all your holdings and positions together.
Why Fragmented PnL Creates Bad Decisions
Most serious crypto users do not trade from one account. They may hold long-term assets on one exchange, use another for derivatives, maintain a DeFi wallet, and keep stablecoin balances available for future entries. Looking at each venue separately makes it difficult to see net exposure.
Consider a trader who owns BTC spot on one exchange and holds a BTC perpetual short elsewhere. The spot account may show a large gain after a price increase, while the derivatives account shows a loss. Neither screen alone explains the trader's actual portfolio outcome. The key question is the combined exposure: how much BTC risk remains after the hedge, and how has the entire structure performed after fees and funding?
The same issue appears with stablecoins and quote currencies. Cash parked across several exchanges can be overlooked, making a portfolio appear more aggressively allocated than it really is. Conversely, a trader can underestimate exposure when the same asset is held in several places under different trading pairs.
Real-time aggregation reduces this blind spot. It provides one operating view rather than forcing users to reconcile balances, entries, and price changes manually across tabs and spreadsheets.
Realized vs. Unrealized PnL Matters
A dashboard that displays a single profit number may be convenient, but it can hide meaningful differences. Unrealized PnL reflects open positions that are still subject to market movement. Realized PnL reflects completed transactions, although its exact calculation depends on accounting rules and the data available.
This distinction matters operationally. A trader with strong unrealized gains may decide to reduce exposure, set a stop, or rebalance into stablecoins. A trader with realized gains may need to prepare for tax consequences, depending on jurisdiction and transaction type. Treating the two figures as interchangeable can lead to poor risk decisions and incomplete reporting.
Cost-basis methodology also affects reported realized results. FIFO, LIFO, and HIFO can produce different outcomes when an investor has acquired the same asset at multiple prices. A performance dashboard may use one method for a clear trading view, while tax reporting may require a method consistent with applicable rules and records. The numbers should be connected, but they should not be assumed to be identical.
What Makes a PnL Figure Reliable
Real time does not mean flawless or instantaneous under every condition. It means the data is updated frequently enough to support active oversight, based on current exchange and market inputs. Reliability depends on the quality of those inputs.
First, transaction history must be complete. Deposits, withdrawals, trades, conversions, staking rewards, airdrops, and transfers between connected accounts can all affect balances or cost basis. Missing history can make a current balance look accurate while leaving PnL calculations incomplete.
Second, price sources need sensible asset mapping. Crypto markets trade the same underlying asset against different quote currencies, and smaller tokens may have limited liquidity. A platform must identify the asset correctly and use a defensible market price. For thinly traded assets, the displayed value may be less precise than for BTC, ETH, or major stablecoins.
Third, derivatives data requires special care. Mark price, last traded price, index price, funding, and liquidation thresholds are not interchangeable. Traders should know which metric is powering the displayed PnL and which metric their exchange uses for liquidation.
Finally, fees matter. Small fees may appear insignificant on one trade, but frequent execution, funding costs, and withdrawal fees can materially change net performance over time. Gross PnL is useful for evaluating a trade idea. Net PnL is more useful for evaluating whether the strategy actually worked.
Using Real Time PnL to Manage Risk
The best use of live PnL is not constant intervention. It is structured awareness. Start by looking at the total portfolio change, then identify the positions and venues driving it. A 4% portfolio move is more actionable when you know whether it came from a concentrated altcoin position, broad market beta, leverage, or an unbalanced hedge.
Allocation data adds the context PnL alone cannot provide. A position that has performed well may now represent too much of the portfolio. Rebalancing is not an admission that the asset will fall. It is a decision to control concentration after price appreciation has changed the portfolio's shape.
Alerts are also more effective when tied to a plan. A price alert can tell you when an asset reaches a level. A PnL threshold can help you review whether an open position still fits your original risk parameters. Neither should replace judgment, but both reduce the need to monitor markets continuously.
For derivatives traders, live PnL should always be viewed alongside margin usage and liquidation distance. A green PnL number can create false confidence when leverage is high. What matters is not only whether a position is winning, but how much adverse movement the account can absorb.
A Practical Multi-Exchange Workflow
A useful workflow begins with read-only data connections. By connecting supported exchange accounts through API keys without trading or withdrawal permissions, traders can centralize visibility while retaining custody and execution control at their existing venues.
Review total value and daily PnL first. Then check allocation by asset, exchange, and account type. From there, inspect open positions, recent realized PnL, and any fees or funding that are affecting results. This order prevents a single trade from dominating attention before you understand its portfolio-level impact.
It also helps to establish a regular reconciliation habit. If an exchange balance, transfer, or transaction does not appear as expected, investigate it before relying on the performance figures. Live dashboards reduce manual work, but they do not eliminate the need for clean source data.
The Crypto Hub is designed around this operational need: one non-custodial command center for exchange-connected portfolio tracking, performance analysis, allocation monitoring, and tax-ready reporting. The goal is not to replace your exchanges or execute trades for you. It is to eliminate the scattered view that makes active crypto management harder than it needs to be.
Real Time PnL Is a Decision Tool, Not a Prediction Tool
A current PnL number cannot tell you where the market goes next. It cannot validate an entry after the fact, remove volatility, or turn every open gain into a successful exit. It can, however, show the present consequences of your decisions with far more clarity than disconnected exchange balances can.
Use that clarity to ask better questions: What is my net exposure? Which position is driving today's result? Are fees changing the strategy's economics? Has a winning asset become an oversized allocation? Do my reported performance figures match the transaction data I will need later?
When those answers are available in one place, portfolio management becomes less reactive. The next useful action is usually not another trade. It is a clear view of the risk you already have.
Share this article